Introduction
Does GDP per capita impact the likelihood of civil unrest in a country? In this study, I plan to evaluate the extent to which per capita GDP impacts the number of riots a country experiences. I expect countries with higher per capita GDP to experience less riots than countries without. Competition for scarce resources between divided groups as well as general unrest due to financial pressures may increase the likelihood of a riot. In this study, I will also include analyses holding education levels and racial tension constant as possible confounding variables. Finally, I will evaluate the causality of the relationship between per capita GDP and civil unrest and the limitations of my study.
Data
The data I’m using in this study comes from a global-scale Political Violence Dataset, a cross-sectional study that records data on GDP, civil unrest, government overthrows, and more. My independent variable is per capita GDP defined by the variable lrgdp80 which records the log of real per capita GDP for a given country in 1980. My dependent variable is riots80, the number of riots a country experienced in 1980, with riots defined as any violent demonstration or clash of more than 100 citizens. I will also run a multiple regression with lschool80, a variable defined as the log of 1 + average years of school attainment in 1980. This regression will also include the variable racialt, defined as racial tension for 1984 with the values 1 (low tension) to 6 (high tension).
If I observe a higher frequency of riots for countries with lower per capita GDP, this would support my hypothesis. If I observe a lower frequency or same frequency, this would provide evidence against my hypothesis. When I run my regression of the count of riots on the per capita GDP variable, a negative, significant coefficient would indicate support for my hypothesis.
Below is a plot that summarizes the dependent variable:
unrest <- read_csv("violence.csv")


dist <- unrest |>
  drop_na(lrgdp80, riots80) |>
  ggplot(mapping = aes(x = lrgdp80, y = riots80)) +
  geom_point() +
  labs(title = "Distribution of riots in 1980 by Per Capita GDP",
                  x = "Log of real per capita GDP for a given country",
                  y = "Number of Riots")

dist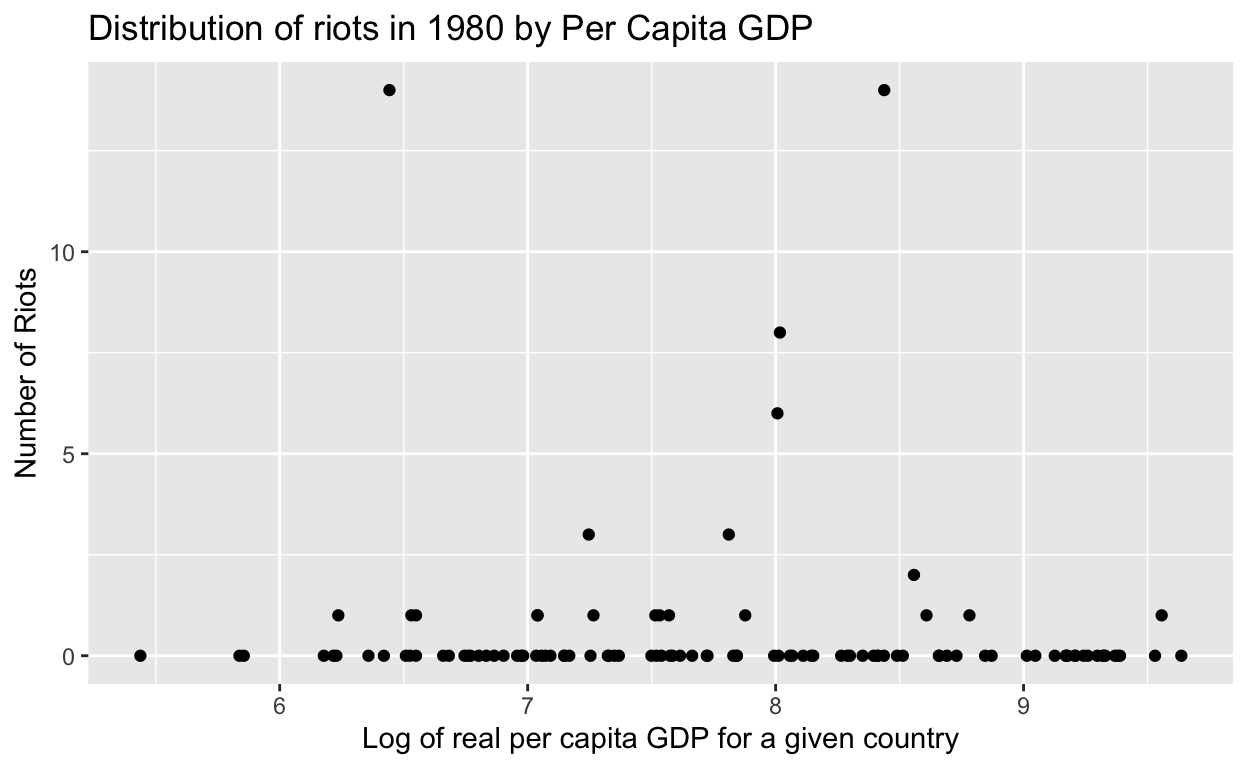
Results
regplot <- unrest |>
  drop_na(lschool80) |>
  ggplot(mapping = aes(x = lrgdp80, y = riots80)) +
  geom_point() +
  geom_smooth(method = lm) +
  labs(title = "Distribution of riots in 1980 by Per Capita GDP",
                  x = "Log of real per capita GDP for a given country",
                  y = "Number of Riots")

reg <- lm(riots80 ~ lrgdp80, data = unrest)
reg2 <- lm(riots80 ~ lrgdp80 + lschool80 + racialt, data = unrest)

modelsummary::modelsummary(list(reg, reg2),
                           statistic = c("s.e. = {std.error}",
                                         "p = {p.value}"),
gof_map = c("nobs", "r.squared", "adj.r.squared"))| Model 1 | Model 2 | |
|---|---|---|
| (Intercept) | 1.299 | 2.483 |
| s.e. = 1.587 | s.e. = 2.925 | |
| p = 0.415 | p = 0.399 | |
| lrgdp80 | −0.092 | −0.151 |
| s.e. = 0.202 | s.e. = 0.515 | |
| p = 0.648 | p = 0.770 | |
| lschool80 | 0.643 | |
| s.e. = 0.873 | ||
| p = 0.464 | ||
| racialt | −0.414 | |
| s.e. = 0.190 | ||
| p = 0.033 | ||
| Num.Obs. | 109 | 78 |
| R2 | 0.002 | 0.079 |
| R2 Adj. | −0.007 | 0.042 |
reg
Call:
lm(formula = riots80 ~ lrgdp80, data = unrest)

Coefficients:
(Intercept)      lrgdp80
    1.29907     -0.09247
reg2
Call:
lm(formula = riots80 ~ lrgdp80 + lschool80 + racialt, data = unrest)

Coefficients:
(Intercept)      lrgdp80    lschool80      racialt
     2.4827      -0.1510       0.6433      -0.4138
regplot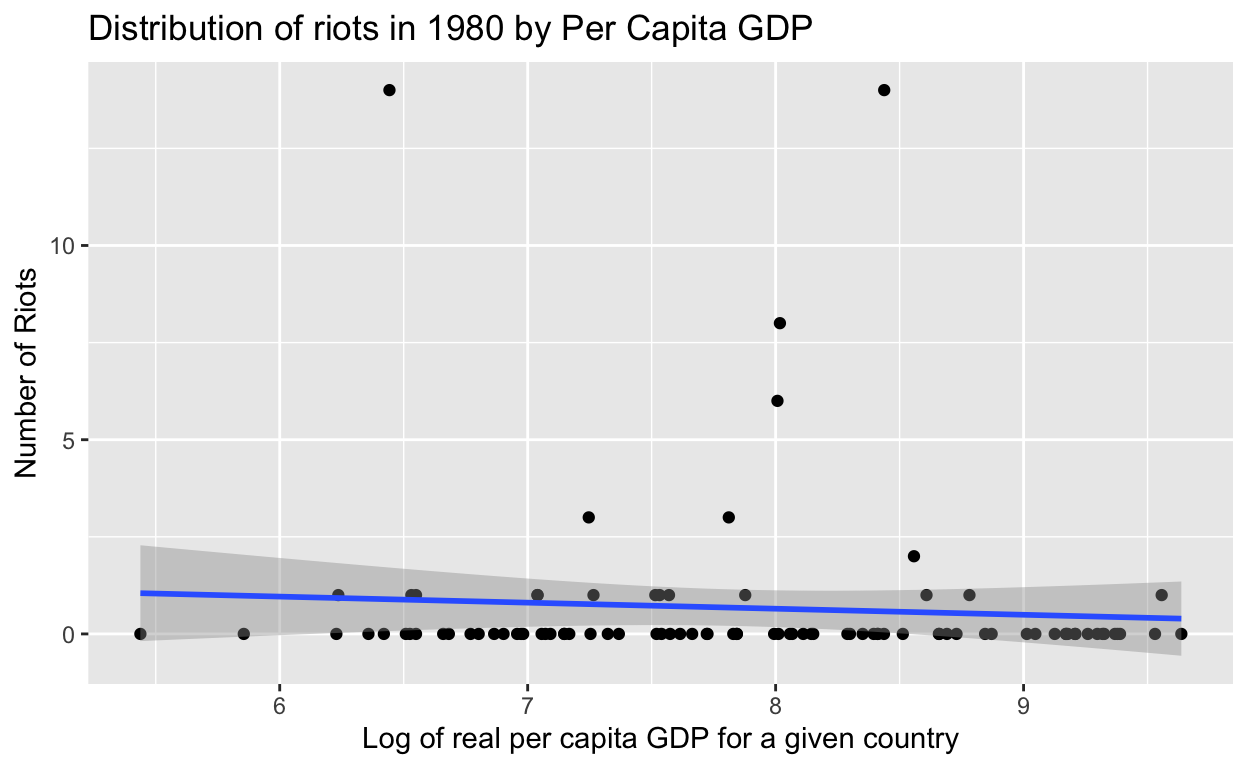
The main linear regression model is trying to predict the number of riots (riots80) based on the natural logarithm of gross domestic product (lrgdp80) in 1980. The model suggests that there is a negative relationship between the number of riots and the natural logarithm of GDP, such that an increase in GDP is associated with a decrease in the number of riots. The intercept of the model (1.29907) suggests that when the natural logarithm of GDP is 0, the predicted number of riots is 1.29907. In this model, the intercept does not have a direct interpretation in terms of the real world, because it is unlikely that a country would have a GDP of 0. The coefficient for lrgdp80 (-0.09247) indicates that for every unit increase in the natural logarithm of GDP, the predicted number of riots decreases by 0.09247. This suggests a slightly negative relationship between log per capita GDP and riots.
The intercept of the multiple regression model is 2.4827, which is the predicted value of the dependent variable (in this case, the number of riots) when all of the independent variables are equal to 0. This suggests that, when the other variables in the model are not taken into account, the model predicts that there will be about 2.48 riots. Again, this is probably not meaningful in the context of this study as it’s unlikely for a country to have 0 GDP. The coefficient for the lrgdp80 variable is -0.1510, which indicates that for every unit increase in log per capita GDP, the number of riots is predicted to decrease by 0.15, controlling for the other variables. The coefficient for the lschool80 variable is 0.6433, which indicates that for every unit increase in log years of schooling, the number of riots is predicted to increase by 0.64, controlling for the other variables. The coefficient for the racialt variable is -0.4138, which indicates that for every unit increase in racial tension, the number of riots is predicted to decrease by 0.41, controlling for the other variables.
pvalue <- summary(reg)$coefficients[, "Pr(>|t|)"]

pvalue
(Intercept) lrgdp80
0.4147589 0.6476668 Based on these p-values, it appears that the relationship of the main linear regression model is not statistically significant. The p-value for the (Intercept) coefficient is 0.4147589, which is greater than the commonly-used significance level of 0.05. Similarly, the p-value for the lrgdp80 coefficient is 0.6476668, which is also greater than 0.05. Because at least one of the p-values is greater than 0.05, the model cannot be considered statistically significant at the 0.05 significance level. We can’t claim a causal relationship between log per capita GDP and civil unrest as measured by riots.
Conclusion
I did not find a causal relationship in my study. The linear regression model had a slightly negative correlation between log per capita GDP and riots, but this was not a statistically significant relationship. There were several limitations of my study. Firstly, I measured civil unrest in this study with number of riots a country experienced. With more comprehensive data, I can expand this definition to include other aspects of civil unrest. Similarly with more comprehensive data, I can control for many more variables that could confound a relationship like this. Other variables could include income inequality and governmental corruption. Moreover, this study is limited by its scope as well. I could improve this study by broadening the timeframe from 1 year to several decades to observe more trends in GDP and civil unrest.